Friday, January 29, 2016

Azure WebApp Performance testing

Got chance to work on Azure platform and its Web App Performance testing. Followed below approach/strategies for load testing

1) Test Approach: -
We can use below approaches to generate the load
1. Using Jmeter load test to scale the concurrent user
2. We can also do Azure web app load test using Azure VSO. (Virtual Studio online). Online Performance testing feature provided by Azure. You have another option which is VSO. Azure cat should be able to add your account to VSO online. The benefits of this approach is that you do not have to take care of the infrastructure. Also probably is easier for most of MS skill sets to write web tests than crafting test plans in JMETER: http samplers, recording etc.

2) Resource Utilization / Application Performance Metric For Azure webapp :-
1. We can check application response time , throughput using Jmeter, VSO Summary Report
2. Use an Azure telemetry framework in the application. Also Azure market place offers new relic and Telemetry framework will offer you system Performance Metric across the tiers, application Performance Metric, backend dependencies

3) Performance Test Strategies: -
1. User Provisioning: - To provision the users that you need you will have to set up your ADFS with a DC on the cloud. This is the recommended set up.
2. Randomize the users so each thread in JMETER is running in  an unique authentication session
3. Define your business scenarios in a mix of real world workload and design them accordingly in JMETER test plan
4. For JMETER infrastructure you can spawn VMS in virtual network in Azure . You will have to set this up manually and allocate the number of VMS to drive the workloads
Wednesday, September 30, 2015

How to identify memory leaks in java

 while working on one the java email-messaging application, we encountered memory leak. following are some points to identify memory leak
  1. On unix systems, use top command to check RSZ (residential memory) for particular java application
  2. you can capture RSZ by creating scipts OR any resource utilization tool

 - generally memory leak will get observed during long duration test.
 - after long duration test, you can generate graph from captured resource utilization and verify for RSZ memory graph. If it shows linear graph,
 then we can say its memory leak

What to check during heap dump analysis
 - check leak suspect report in eclipse MAT
 - In dominator tree, check classes and its instances,which having maximum retained heap. max retained heap instance causes memory leak
 - Class Histogram shows the classes found in the snapshot, the number of objects for each class, the heap memory consumption of these objects, and the minimum retained size of the objects
 - observe GC activity and its frequency.

How to solve memory leak problem.
 As per my experience following points need to consider to get out of memory leak issue.
 1. try increasing -Xmx in heap size ( its should be 70% of RAM)
 2. take heap dump using jmap/jhap tool and analyse heap dump with JvisualVM/Eclipse MAT.
 3. check GC frequency duration GC activity.
 

Thursday, August 13, 2015

building work load model and creating business scenario for load testing.

To explain work load modelling, would like to give inventory order processing example.
Requirement:-
There is inventory management portal to create,process,submit the orders. And user uses this application for 8 hours in a day(including 1 hour break)
with 200 users,in 8 hours 600 orders  get processed manually.

As performance testing we have following requirement
- Identify the minimum time of load testing
- Identify application behavior during  peak load
-

Strategy
- write down business use cases according to its order processing
- break the test cases as
  1. create order
  2. process order
  3. submit the orders
- We can do load testing of 60 order for 1 hour
 
Simulating load test using Jmeter
- create jmeter script for create , process, submit orders
- individual load testing for create,process,submit orders
- mix load testing for above orders
- peak load testing using Synchronizing Random timer after 15 mins of load start (No. of simulated user=50, Timeout=2000 ms)

Wednesday, May 27, 2015

Linux/AIX Resource monitoring tools used during performance/load testing

 1. NMON  :-
   - we can use NMON in 2 ways 1. interactive 2. recording . Following is example of recording various parameters
     nmon  -ftm <nmon_stat> -s 300 -c 7200000
      - above command will start nmon for 7200000*300 times in nmon_start folder. It will create <timestamp>.nmon file to save the stats
 - to analyze results, we can use nmon_analyser_v42(provide .nmon file as input to MS excel sheet to generate various graphs)
 - Download analyser from below link.


  2. sar :-
    - sar collects the stats for CPU,memory,IO,Network related activity
- We can use ksar to generate graph from collected data.
   LC_ALL=C sar -A -f /var/log/sa/sa > /tmp/sar_report.txt

  3. vmstat :-
  procs -----------memory---------- ---swap-- -----io---- --system-- -----cpu-----
   r  b   swpd   free   buff  cache   si   so    bi    bo   in   cs us sy id wa st
   0  0      0 16836884 202724 2405112    0    0     0     1    0    0  0  0 100  0  0
    r - no. of running processes
    b - no. of blocked processes,waiting for resource
    buff- buffer for I/O operation
    cache- cached by OS
    bi- blocks(1k) read from hard disk
    bo- blocks write into hard disk
    in - interrupts per sec
    cs - no. of context switched per second. - switching of CPU from one process to another

>> How to free memory in AIX
set as 
$vmo -o minperm%=1 -o maxperm%=1 -o strict_maxperm=1 -o minclient%=1 -o maxclient%=1
Restore origninal value:- 
$vmo -o minperm%=3 -o maxperm%=90 -o strict_maxperm=90 -o minclient%=67 -o maxclient%=90

  4. TOP

  5. PS
   - $ ps -eLF | grep java |wc -l :-  it will give total count of java processes(threads)

Memory leak analysis for C++, Java application

Once we observe linear memory growth during endurance load testing, we could suspect about memory leak in application

 1. C++ -
       we can use following tool to analyse memory leak in c++ application
1. valgrind : -
          -   Valgrind is tool with which we can analyses memory leak for C++ application.
On linux machine it should available.  Start the application with below parameters. Note- Your application will become slow once you start with valgrind.
valgrind --tool=memcheck --leak-check=full --show-reachable=yes --num-callers=20 --track-fds=yes --leak-resolution=high --trace-children=yes -v <binary file> <arg1> <arg2>
    - valigrind report analysis : -  Check following categories from text report.
Still reachable blocks
Definitely Lost blocks
Indirectly Lost:
Possibly Lost


 Reference :-
  http://valgrind.org/docs/manual/manual.html


 2. Java -
        1. Eclipse Memory Analysis Tool - We used E-MAT to analyse heapdump(generate by application because of HeapDumpOnOutOfMemoryError). We loaded 2G heapdump in E-MAT ( Note:- E-MAT machine having 32G memory and 12 core cpu)
- once heapdump gets load in tool, it will provide following high level report
 - Leak Suspect Report :- shows classes/object which consumed more heap.
 - Check Histogram of dominator tree :- Check Retained Heap size ( retained heap si addition of the shallow heap size of all objects that would be removed when this object is garbage collected)
             here max retained heap size instances could be suspected objects. If we drill down dominator tree more, we can identify object which holds more memory

Reference link:-
 http://eclipsesource.com/blogs/2013/01/21/10-tips-for-using-the-eclipse-memory-analyzer/
 
        2. JVisualVM :-
          we can analyaze java application using jvisualvm tool(D:\test\jdk1.7.0_45\bin\jvisualvm.exe) by locally or remotely
         - we can monitor  :-  CPU usage, heap, no. of threads
- Thread analysis
- Profiler - we can monitor CPU uses by each method
           - In memory profiling visualvm, gives max usage of heap by classes, instances.
- VisualGC - We need install VisualGC plugin from Tool > Plugins
           - This plugin monitor GC activity - the Perm gen, Eden space, GC time
 For more detail please go through below link :-
  http://myloadtesting.blogspot.in/2015/02/performance-analysis-using-jvisualvm.html
   

Tuesday, May 26, 2015

How to debug jmeter script


There are different way to debug jmeter script. You can use following Postprocessor
 1. Debug PostProcesssor
    - You need to add as child in every sampler (e.g HTTP Request)
- Check value of variable in View Result Tree > Sampler's output

 2. BeanShell Postprocessor
   - You can log the variable value in jmeter.log file
     e.g ${__log("-Counter value-------------${counter} --------------")};

 3. You can user PostProcesssor > Regular Expression Extractor to check regex and its output

 4. Response Assertion :- We can use it to check both things. 1. Verify response and any specific Pattern by giving different rules

Friday, May 15, 2015

High CPU utilization - how to analyze high CPU utilization for java application


Problem:-
During load testing, many time we observed high CPU utilization and we need to analyze it usages. Here some steps to identify high CPU utilization bottleneck
1. For java application, we can take thread dump(jstack) to check how many thread are blocked/waiting
3. Check GC frequency, If there is less memory allocated then there could be chance of high GC run, for which it requires more CPU cycles.

Analysis using monitoring tools:-

1. using vmstat,check waiting for running(r), uninterruptible sleep (b) thread count.
    1. vmstat :-
procs -----------memory---------- ---swap-- -----io---- --system-- -----cpu-----
 r  b   swpd   free   buff  cache   si   so    bi    bo   in   cs us sy id wa st
 0  0      0 16836884 202724 2405112    0    0     0     1    0    0  0  0 100  0  0
   - check CPU section for user(us) utilization.
   - check for context switches(cs)
 
  2. top : -

Possible solutions(as per my experience):-
 Application level tuning: -
   1. First, identify high cpu process id and convert it into hex. Now take thread dump and search for nid=<process id hex>, here you can identify which code/class causing issue
   2. Increase total no. of threads in configuration file
   3. Increase connection pool in configuration file

 
 Reference:-
 http://careers.directi.com/display/tu/Understanding+CPU+Utilization+and+Optimization

Jmeter Functions

While working on jmeter functions, tried following functions in scripting
- For logging in log file, we can use following function in <BeanShell Postprocessor> OR <BeanShell Sampler>


1. ${__log("-Thread Number---------------${__threadNum()} --------------")};
sample output :-
INFO  - jmeter.functions.LogFunction: Thread Group 1-1 : "-Thread Number---------------1 --------------"

2. ${__log("-Counter---------------${__counter(true,c)} --------------")};
sample output :-
INFO  - jmeter.functions.LogFunction: Thread Group 1-1 : "-Counter---------------38 --------------"

3. ${__log("-Request/Sampler---------------${__samplerName(s)}--------------")};
sample outout :-
INFO  - jmeter.functions.LogFunction: Thread Group 1-1 : "-Request/Sampler---------------/static/94262ec5/images/48x48/notepad.png--------------"

4. ${__log("----------------${__machineIP(ip)}--------------")};

${__log("----------------${__machineName(mname)}--------------")};

${__log("-Time---------------${__time(YMDHMS)} --------------")};
sample output in log file:-
INFO  - jmeter.functions.LogFunction: Thread Group 1-1 : "-Time---------------20150518-112329 --------------"

${__log("----------------Success--------------")};

${__log("-split---------------${__split(testamark,var,a)} --------------")};
${__log("-Var1---------------${var_1} --------------")};
${__log("-Var2---------------${var_2} --------------")};
${__log("-Var3---------------${var_3} --------------")};
sample output:-
jmeter.functions.LogFunction: Thread Group 1-1 : "-split---------------testamark --------------"
jmeter.functions.LogFunction: Thread Group 1-1 : "-Var1---------------test --------------"
jmeter.functions.LogFunction: Thread Group 1-1 : "-Var2---------------m --------------"
jmeter.functions.LogFunction: Thread Group 1-1 : "-Var3---------------rk --------------"

${__log("-Property Value---------------${__property(user.dir)} --------------")};
sample output:-
INFO  - jmeter.functions.LogFunction: Thread Group 1-1 : "-Property Value---------------D:\data_bkup\PEG\apache-jmeter-2.7\apache-jmeter-2.7\bin --------------"

Tuesday, May 12, 2015

Automate Jmeter load tests with Jenkin and Maven

As you know is Jenkin is widely used  tool for Continuous Integration in performance testing, So given tried for installation/configuration of Jenkin. Following are short step to automate load testing process(jmeter scripts) in Jenkin.

1. Configure apache-maven for jmeter script repository
  #cd /usr/local/apache-maven-3.1.1
  #export PATH=$PATH:/usr/local/apache-maven-3.1.1/bin
2. Create pom.xml in above repository(/var/tmp/jmeter-demo)
  #/var/tmp/jmeter-demo
3. Verify repository by - mvn verify
   -  Maven will download and install jmeter related jar in repository
   - e.g Repository path :
[root@Cassandra jmeter-demo]# ls
pom.xml  src  target
jmeter jar: target/jmeter/lib/ext/
Content of pom.xml
---------------------
<project xmlns="http://maven.apache.org/POM/4.0.0" xmlns:xsi="http://www.w3.org/2001/XMLSchema-instance"
        xsi:schemaLocation="http://maven.apache.org/POM/4.0.0 http://maven.apache.org/maven-v4_0_0.xsd">
        <modelVersion>4.0.0</modelVersion>
        <groupId>com.example</groupId>
        <artifactId>jmeter-demo</artifactId>
        <packaging>jar</packaging>
        <version>1.0-SNAPSHOT</version>
        <name>jmeter-demo</name>
        <url>http://maven.apache.org</url>

        <build>
                <plugins>
                        <plugin>
                                <groupId>com.lazerycode.jmeter</groupId>
                                <artifactId>jmeter-maven-plugin</artifactId>
                                <version>1.4.1</version>
                                <executions>
                                        <execution>
                                                <id>jmeter-tests</id>
                                                <phase>verify</phase>
                                                <goals>
                                                        <goal>jmeter</goal>
                                                </goals>
                        <configuration>
                                <proxyConfig>
                                    <host>proxyhost</host>
                                    <port>8181</port>
                                    <username>username</username>
                                    <password>password</password>
                                    <hostExclusions>localhost</hostExclusions>
                                </proxyConfig>
                            </configuration>
                                        </execution>
                                </executions>
                        </plugin>
                </plugins>
        </build>
</project>
---------------------------

4. Install jenkin rpms and start jenkin ( #/etc/init.d/jenkins start)
5. Load performance plugin through jenkin UI
6. Create Project from jenkin UI
7. onfigure project for jmeter
    - In Build section, add pom.xml path
    - In Post-build Action > Add New report > Jmeter > give path for .jtl file
- Save the configuration
7. Start build. Once build complete check performance Trend


Reference:-
https://wiki.jenkins-ci.org/display/JENKINS/Performance+Plugin 

Tuesday, February 17, 2015

Capacity Planning from response time using R

While going through session of Capacity planning using Statistical pattern - R
- Based on load testing report, we can identify resource utilization using R project
- We can give input of different response time to R and estimate required CPU core


Refrence:-
http://www.r-project.org/

mysql database profiling using JetProfiler

While working with mysql database found issue in mysql tuning, so used JetProfiler for mysql analysis
- Used to verify no.of  threads
- Also verified no. of connections to mysql
- Verified open tables by mysql
- Also Top queries which are taking most of execution time.

Friday, February 13, 2015

Profiling using JVisualVM


Got chance to do performance analysis for java application, For that used JVisualVM for application profiling, heap dump, thread dump analysis
Add following details in application's jvm config
-Dcom.sun.management.jmxremote.port=<jmx port>           
-Dcom.sun.management.jmxremote.authenticate=false
-Dcom.sun.management.jmxremote.ssl=false
-Djava.rmi.server.hostname=<tomcat server ip>         
Open /java/bin/jvisualVM on localhost
  - Add Remote host
  - Add JMX connection host:jmxport
once you above connection details, you will get panel for application with Overview,Monitor,Threads,Sampler tabs
1. In Monitor tab you can see CPU usage for that application, HEAP monitoring, loaded classes, total Threads 
 2. In Threads tab you monitor Live Threads, Finished threads.
3. One of the important tab is Sampler for profiling the application with respect to CPU, Memory
   - Once you click on CPU, JvisualVM started collection of method's self time and Self Time(CPU). You can also see Thread CPU time
   IMP:-
    Self Time: total time spent invoking this method. If a method was called twice, the self-time will be the sum of the time spent in each call excluding internal method calls.
    Self Time (CPU): the same as Self Time except that only CPU execution time is considered, omitting I/O operations.
    Total Time: total time spent invoking this method including internal method calls.
    Total Time (CPU): total CPU time spent invoking this method including internal method calls
   - Memory profiling :- Here you can see loaded classes and its instances with its size in bytes

In Profiling, From CPU  snapshot we can identify the methods which having high self time (cpu), no. of methods invocation and we can work on it as performance bottleneck.
We can do more performance analysis during heap dump, thread dump


Reference:--
https://blogs.oracle.com/nbprofiler/entry/profiling_with_visualvm_part_1

https://profiler.netbeans.org/docs/help/5.5/results_objliveness.html
https://profiler.netbeans.org/docs/help/5.5/snap_cpu.html
 

Sunday, February 8, 2015

UI Performance Analysis

Got Chance to do analysis for website performance issue.(response time was high for some of the post requests)

-   To get response time of each request ,we used Chrome browser and it's Developer tool feature.
-  For analysis we used Page Speed (which is external plugin for chrome browser). It gives recommendation to reduce response time ( e,g make post call parallel , minify java script, image compression, inline java script )

Also used WATIR (ruby) script for automation script to get response time for different builds

Friday, January 9, 2015

JBoss Profiler Installation:

JBoss Profiler Installation:
1) copy jboss-profiler-noAOP.sar to the JBoss AS deploy directory
2) put jbossInspector.dll in your PATH (Windows)
or libjbossInspector.so in your LD_LIBRARY_PATH (Linux/Unix)
3) copy jboss-profiler.war to the JBoss AS deploy directory
Configuration:
1) Add something like this to the JBoss JVM options: -XrunjbossInspector:/tmp/profiler,include=com.unisys,ignore=*,memory=false
Make sure the output directory (/tmp/profiler in this example) exists.
Usage:
1) In the jmx-console, use the jboss.profiler Native-profiler mbean to activate profiling
2) Exercise your application
3) In the jmx-console, use the jboss.profiler Native-profiler mbean to stop profiling (if you forget to do this, you will
probably get a java.io.EOFException when you try to use the analyzer war)
4) Analyze results using the JBoss Profiler web app at localhost:8080/jboss-profiler
Example analysis:
a. Click on 'Runtime Profiler'
b. Enter the output directory, for example, /tmp/profiler
c. Check 'Stack on methods', uncheck other options and submit
d. Click 'click here'
e. Click the 'All Methods' link to get a view of time allocation among individual methods

Sunday, December 7, 2014

Performance Testing Report

You can add below content during performance test report
Contents
 1.    Document History   
      1.1    History   
2    Summaries   of  Test Result
     2.1    Test Cases   
     2.2    Test environment   
     2.5    Test Results summary   
** Observation of comparison result with previous test result
3    References & Glossary   
        - Link, books,config guide used as reference during testcase execution
4    Hardware and Software Configuration   
    4.1    Hardware Configuration
    4.2    Software Details   
    4.3    Test Tools     
               - Add various test tools using during test case execution
    4.3.4    Report
            - resource utilization graph report
            - Response time graph
    4.4    Product Installation steps
5    General Testing Guidelines and Test Configuration, Tuning Parameter   
    5.1    Load Test Strategy and Guidelines   
    5.1.1    Summary of Result(e.g response time,resource utilization, observation)
    5.2    Configuration Parameters   
    5.2.1    Default Settings   
6    Major Configuration   
7    Test Results In Detail   
    7.1    Result of Testcase1
    7.2    Result of Testcase2

Test Plan for Performance related testcases

 You can prepare test cases for load testing as below ..
      Doc history
     General Testing Guidelines and Test Configuration   
      Load Test Strategy and Guidelines   
            - End-to-End load testing
            - load testing of each component
     Summary of Deliverables   
            - Application response time,tps in various load strategies
            - resouce utilization
            - tuning, comparison  
     Test Case LOE and Summary   
     Test Case Summary   
     Test Case Descriptions   
     Scalability and Sustainability  Tests   
     UI(website) Sustainability (concurrent sessions)   
     feature1 Throughput
     feature2 Throughput   
     Mixed Load Sustainability (feature1+featrure2+...+featureN)        
     Fault Tolerance   

Tuesday, November 25, 2014

remote jmeter load testing : jmeter setup for aggregate results

We can aggregate multiple jmeter report for same test plan on single jmeter with below steps. For that we need jmeter-server to be started.

1. Configuration for Linux machine: -
Jemter-server1 (to execute test plan)
<Server-host1>:  /var/tmp/Jmetertest/jmeter/bin/jmeter-server
${DIRNAME}/jmeter ${RMI_HOST_DEF} -Dserver_port=${SERVER_PORT:-1099} -s -j jmeter-server.log "$@"

Jmeter-server2 (to execute test plan)
<Server-host2>:  /var/tmp/Jmetertest/jmeter/bin/jmeter-server
${DIRNAME}/jmeter ${RMI_HOST_DEF} -Dserver_port=${SERVER_PORT:-1099} -s -j jmeter-server.log "$@"

Jmeter-client (To aggregate results from both jmeter) – Start load test from client
<Client-host1>:  /var/tmp/Jmetertest/jmeter/bin/jmeter.properties
remote_hosts=x.x.x.x:1099,y.y.y.y:1099

2.  Configuration on windows machine :-
 Master1 :
 1. Go to jmeter/bin folder from command line
 2. d:\> set SERVER_PORT=1099
 3. Run command :- jmeter-server
 4. Following logs from jmeter-server.log
D:\data_bkup\pache-jmeter-2.7\apache-jmeter-2.7_server1\bin>jmeter-server

Created remote object: UnicastServerRef [liveRef: [endpoint:[10.77.69.204:5580](
local),objID:[-301b09ee:14d6fdfb82b:-7fff, -2413427225664758460]]]
Starting the test on host <Master1>:1099 @ Wed May 20 11:20:50 IST 2015 (1432101
050801)

 Master2 :
 1. Go to jmeter/bin folder from command line
 2. d:\> set SERVER_PORT=2099
 3. Run command :- jmeter-server
 4. Following logs from jmeter-server.log

D:\data_bkup\apache-jmeter-2.7\apache-jmeter-2.7_server2\bin>jmeter-server
Created remote object: UnicastServerRef [liveRef: [endpoint:[10.77.69.204:5681](
local),objID:[6b47ad4e:14d6fe12c3b:-7fff, 2198693937862588508]]]
Starting the test on host <Master2>:2099 @ Wed May 20 11:22:39 IST 2015 (1432101
159039)

 Client Machine:
 Go to <Client-host1>:jmeter.properties. Change following property
remote_hosts=<Master1>:1099,<Master2>:2099
 1. Start jmeter
 2. Open TestPlan
 3. Run > Remote Start All
jmeter.log >
2015/05/20 11:23:23 INFO  - jmeter.gui.util.JMeterMenuBar: setRunning(true,<Master1>:1099)
2015/05/20 11:23:23 INFO  - jmeter.engine.ClientJMeterEngine: sent test to <Master2>:2099 basedir='.'
2015/05/20 11:23:23 INFO  - jmeter.engine.ClientJMeterEngine: Sending properties {}
2015/05/20 11:23:23 INFO  - jmeter.engine.ClientJMeterEngine: sent run command to <Master2>:2099


- To start load from all remote  client Go to Run > Remote Start All Client


Monday, November 24, 2014

Jmeter :- Runtime throughput controlller

 Runtime throughput control in Jmeter load test
 We can control throughput in jmter during runtime using beanshell.server with following steps.

1.    Set following parameter in jmeter.properties
beanshell.server.port=9000
beanshell.server.file=D:/PEG/apache-jmeter-2.7/apache-jmeter-2.7/extras/startup.bsh
2.    Add initial throughput value in jmeter.properties
throughput=10
3.    Start jmeter from command line.
4.    While creating testplan, add Constant Throughput Timer  and  add “${__P(throughput)}”  in Target Throughput  textbox and  Create on BeanShell script (throughput.bsh) and add following code
setprop("throughput","100");
5.    Now start the load run.
6.    From new command window, change the throughput during runtime.
C:\Program Files\Java\jdk1.6.0\bin>java -jar "D:\PEG\apache-jmeter-2.7\apache-jmeter-2.7\lib\bshclient.jar" 127.0.0.1 9000 "throughput.bsh"
  
Note: This is working with jmeter 2.7

basic of slamd

installation and configuration


 http://dl.thezonemanager.com/slamd/
 SLAMD Server:-
 1. To install the SLAMD server using this package, simply extract the contents of the appropriate archive into the location on the filesystem in which you wish to use SLAMD.
2. define the JAVA_HOME environment variable,
3. Start server bin/startup.sh
4. you should be able access the SLAMD administrative interface in a browser using the URL http://{address}:8080/slamd

SLMD Client:- slamd_client-1.8.0.tar.gz
1. The process of installing the SLAMD client is as simple as extracting the archive containing the client files into the desired location on the client system
2. Configure slamd_client.conf
   - vi /root/slamd_client/slamd_client.conf
   - Add server host/port in SLAMD_ADDRESS/SLAMD_LISTEN_PORT
 3. If you just wish to start a single client, then the start_client.sh shell script can be used to do this on UNIX systems

Note: In both cases, it will be necessary to comment out or remove two lines near the top
of the file that require the file to be edited before it can be used to start the client/server.

How to start test?
1 Goto to slamd admin url - http://<hostt>:8080/slamd
2. Schedule the job.
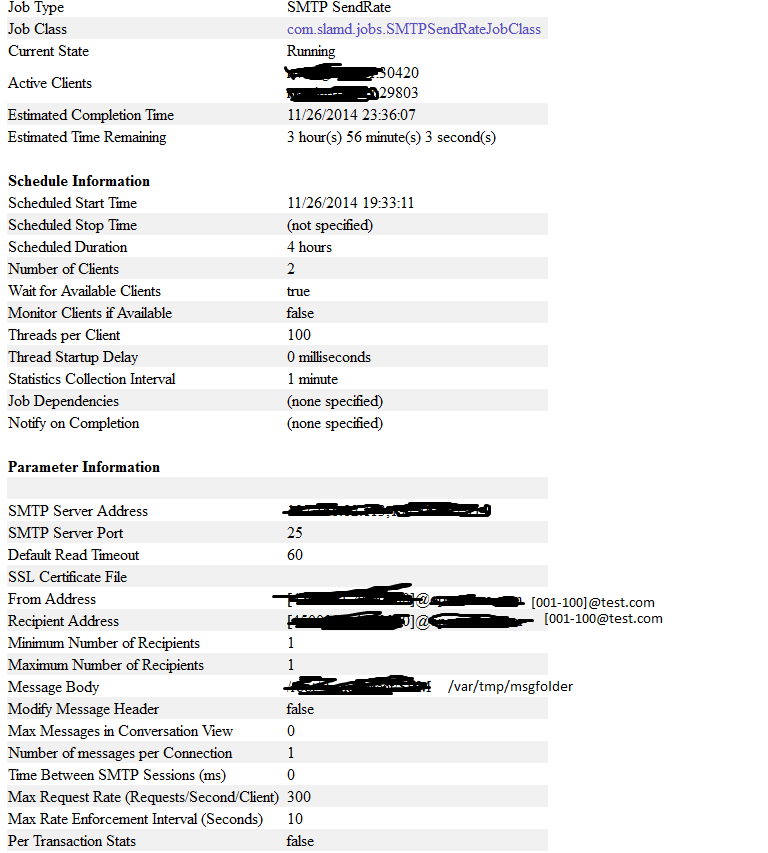
3. Mail Job Classes > SMTP Send Rate
3. Add details in next page
  - Description,Name, Thread per client,
  - From address, Receipent Address: [10000-20001]@xyz.com
  - Mesage body - <path of msg file>
  - Max Request Rate(TPS) : -