Tuesday, February 17, 2015

Capacity Planning from response time using R

While going through session of Capacity planning using Statistical pattern - R
- Based on load testing report, we can identify resource utilization using R project
- We can give input of different response time to R and estimate required CPU core


Refrence:-
http://www.r-project.org/

mysql database profiling using JetProfiler

While working with mysql database found issue in mysql tuning, so used JetProfiler for mysql analysis
- Used to verify no.of  threads
- Also verified no. of connections to mysql
- Verified open tables by mysql
- Also Top queries which are taking most of execution time.

Friday, February 13, 2015

Profiling using JVisualVM


Got chance to do performance analysis for java application, For that used JVisualVM for application profiling, heap dump, thread dump analysis
Add following details in application's jvm config
-Dcom.sun.management.jmxremote.port=<jmx port>           
-Dcom.sun.management.jmxremote.authenticate=false
-Dcom.sun.management.jmxremote.ssl=false
-Djava.rmi.server.hostname=<tomcat server ip>         
Open /java/bin/jvisualVM on localhost
  - Add Remote host
  - Add JMX connection host:jmxport
once you above connection details, you will get panel for application with Overview,Monitor,Threads,Sampler tabs
1. In Monitor tab you can see CPU usage for that application, HEAP monitoring, loaded classes, total Threads 
 2. In Threads tab you monitor Live Threads, Finished threads.
3. One of the important tab is Sampler for profiling the application with respect to CPU, Memory
   - Once you click on CPU, JvisualVM started collection of method's self time and Self Time(CPU). You can also see Thread CPU time
   IMP:-
    Self Time: total time spent invoking this method. If a method was called twice, the self-time will be the sum of the time spent in each call excluding internal method calls.
    Self Time (CPU): the same as Self Time except that only CPU execution time is considered, omitting I/O operations.
    Total Time: total time spent invoking this method including internal method calls.
    Total Time (CPU): total CPU time spent invoking this method including internal method calls
   - Memory profiling :- Here you can see loaded classes and its instances with its size in bytes

In Profiling, From CPU  snapshot we can identify the methods which having high self time (cpu), no. of methods invocation and we can work on it as performance bottleneck.
We can do more performance analysis during heap dump, thread dump


Reference:--
https://blogs.oracle.com/nbprofiler/entry/profiling_with_visualvm_part_1

https://profiler.netbeans.org/docs/help/5.5/results_objliveness.html
https://profiler.netbeans.org/docs/help/5.5/snap_cpu.html
 

Sunday, February 8, 2015

UI Performance Analysis

Got Chance to do analysis for website performance issue.(response time was high for some of the post requests)

-   To get response time of each request ,we used Chrome browser and it's Developer tool feature.
-  For analysis we used Page Speed (which is external plugin for chrome browser). It gives recommendation to reduce response time ( e,g make post call parallel , minify java script, image compression, inline java script )

Also used WATIR (ruby) script for automation script to get response time for different builds

Friday, January 9, 2015

JBoss Profiler Installation:

JBoss Profiler Installation:
1) copy jboss-profiler-noAOP.sar to the JBoss AS deploy directory
2) put jbossInspector.dll in your PATH (Windows)
or libjbossInspector.so in your LD_LIBRARY_PATH (Linux/Unix)
3) copy jboss-profiler.war to the JBoss AS deploy directory
Configuration:
1) Add something like this to the JBoss JVM options: -XrunjbossInspector:/tmp/profiler,include=com.unisys,ignore=*,memory=false
Make sure the output directory (/tmp/profiler in this example) exists.
Usage:
1) In the jmx-console, use the jboss.profiler Native-profiler mbean to activate profiling
2) Exercise your application
3) In the jmx-console, use the jboss.profiler Native-profiler mbean to stop profiling (if you forget to do this, you will
probably get a java.io.EOFException when you try to use the analyzer war)
4) Analyze results using the JBoss Profiler web app at localhost:8080/jboss-profiler
Example analysis:
a. Click on 'Runtime Profiler'
b. Enter the output directory, for example, /tmp/profiler
c. Check 'Stack on methods', uncheck other options and submit
d. Click 'click here'
e. Click the 'All Methods' link to get a view of time allocation among individual methods

Sunday, December 7, 2014

Performance Testing Report

You can add below content during performance test report
Contents
 1.    Document History   
      1.1    History   
2    Summaries   of  Test Result
     2.1    Test Cases   
     2.2    Test environment   
     2.5    Test Results summary   
** Observation of comparison result with previous test result
3    References & Glossary   
        - Link, books,config guide used as reference during testcase execution
4    Hardware and Software Configuration   
    4.1    Hardware Configuration
    4.2    Software Details   
    4.3    Test Tools     
               - Add various test tools using during test case execution
    4.3.4    Report
            - resource utilization graph report
            - Response time graph
    4.4    Product Installation steps
5    General Testing Guidelines and Test Configuration, Tuning Parameter   
    5.1    Load Test Strategy and Guidelines   
    5.1.1    Summary of Result(e.g response time,resource utilization, observation)
    5.2    Configuration Parameters   
    5.2.1    Default Settings   
6    Major Configuration   
7    Test Results In Detail   
    7.1    Result of Testcase1
    7.2    Result of Testcase2

Test Plan for Performance related testcases

 You can prepare test cases for load testing as below ..
      Doc history
     General Testing Guidelines and Test Configuration   
      Load Test Strategy and Guidelines   
            - End-to-End load testing
            - load testing of each component
     Summary of Deliverables   
            - Application response time,tps in various load strategies
            - resouce utilization
            - tuning, comparison  
     Test Case LOE and Summary   
     Test Case Summary   
     Test Case Descriptions   
     Scalability and Sustainability  Tests   
     UI(website) Sustainability (concurrent sessions)   
     feature1 Throughput
     feature2 Throughput   
     Mixed Load Sustainability (feature1+featrure2+...+featureN)        
     Fault Tolerance   

Tuesday, November 25, 2014

remote jmeter load testing : jmeter setup for aggregate results

We can aggregate multiple jmeter report for same test plan on single jmeter with below steps. For that we need jmeter-server to be started.

1. Configuration for Linux machine: -
Jemter-server1 (to execute test plan)
<Server-host1>:  /var/tmp/Jmetertest/jmeter/bin/jmeter-server
${DIRNAME}/jmeter ${RMI_HOST_DEF} -Dserver_port=${SERVER_PORT:-1099} -s -j jmeter-server.log "$@"

Jmeter-server2 (to execute test plan)
<Server-host2>:  /var/tmp/Jmetertest/jmeter/bin/jmeter-server
${DIRNAME}/jmeter ${RMI_HOST_DEF} -Dserver_port=${SERVER_PORT:-1099} -s -j jmeter-server.log "$@"

Jmeter-client (To aggregate results from both jmeter) – Start load test from client
<Client-host1>:  /var/tmp/Jmetertest/jmeter/bin/jmeter.properties
remote_hosts=x.x.x.x:1099,y.y.y.y:1099

2.  Configuration on windows machine :-
 Master1 :
 1. Go to jmeter/bin folder from command line
 2. d:\> set SERVER_PORT=1099
 3. Run command :- jmeter-server
 4. Following logs from jmeter-server.log
D:\data_bkup\pache-jmeter-2.7\apache-jmeter-2.7_server1\bin>jmeter-server

Created remote object: UnicastServerRef [liveRef: [endpoint:[10.77.69.204:5580](
local),objID:[-301b09ee:14d6fdfb82b:-7fff, -2413427225664758460]]]
Starting the test on host <Master1>:1099 @ Wed May 20 11:20:50 IST 2015 (1432101
050801)

 Master2 :
 1. Go to jmeter/bin folder from command line
 2. d:\> set SERVER_PORT=2099
 3. Run command :- jmeter-server
 4. Following logs from jmeter-server.log

D:\data_bkup\apache-jmeter-2.7\apache-jmeter-2.7_server2\bin>jmeter-server
Created remote object: UnicastServerRef [liveRef: [endpoint:[10.77.69.204:5681](
local),objID:[6b47ad4e:14d6fe12c3b:-7fff, 2198693937862588508]]]
Starting the test on host <Master2>:2099 @ Wed May 20 11:22:39 IST 2015 (1432101
159039)

 Client Machine:
 Go to <Client-host1>:jmeter.properties. Change following property
remote_hosts=<Master1>:1099,<Master2>:2099
 1. Start jmeter
 2. Open TestPlan
 3. Run > Remote Start All
jmeter.log >
2015/05/20 11:23:23 INFO  - jmeter.gui.util.JMeterMenuBar: setRunning(true,<Master1>:1099)
2015/05/20 11:23:23 INFO  - jmeter.engine.ClientJMeterEngine: sent test to <Master2>:2099 basedir='.'
2015/05/20 11:23:23 INFO  - jmeter.engine.ClientJMeterEngine: Sending properties {}
2015/05/20 11:23:23 INFO  - jmeter.engine.ClientJMeterEngine: sent run command to <Master2>:2099


- To start load from all remote  client Go to Run > Remote Start All Client


Monday, November 24, 2014

Jmeter :- Runtime throughput controlller

 Runtime throughput control in Jmeter load test
 We can control throughput in jmter during runtime using beanshell.server with following steps.

1.    Set following parameter in jmeter.properties
beanshell.server.port=9000
beanshell.server.file=D:/PEG/apache-jmeter-2.7/apache-jmeter-2.7/extras/startup.bsh
2.    Add initial throughput value in jmeter.properties
throughput=10
3.    Start jmeter from command line.
4.    While creating testplan, add Constant Throughput Timer  and  add “${__P(throughput)}”  in Target Throughput  textbox and  Create on BeanShell script (throughput.bsh) and add following code
setprop("throughput","100");
5.    Now start the load run.
6.    From new command window, change the throughput during runtime.
C:\Program Files\Java\jdk1.6.0\bin>java -jar "D:\PEG\apache-jmeter-2.7\apache-jmeter-2.7\lib\bshclient.jar" 127.0.0.1 9000 "throughput.bsh"
  
Note: This is working with jmeter 2.7

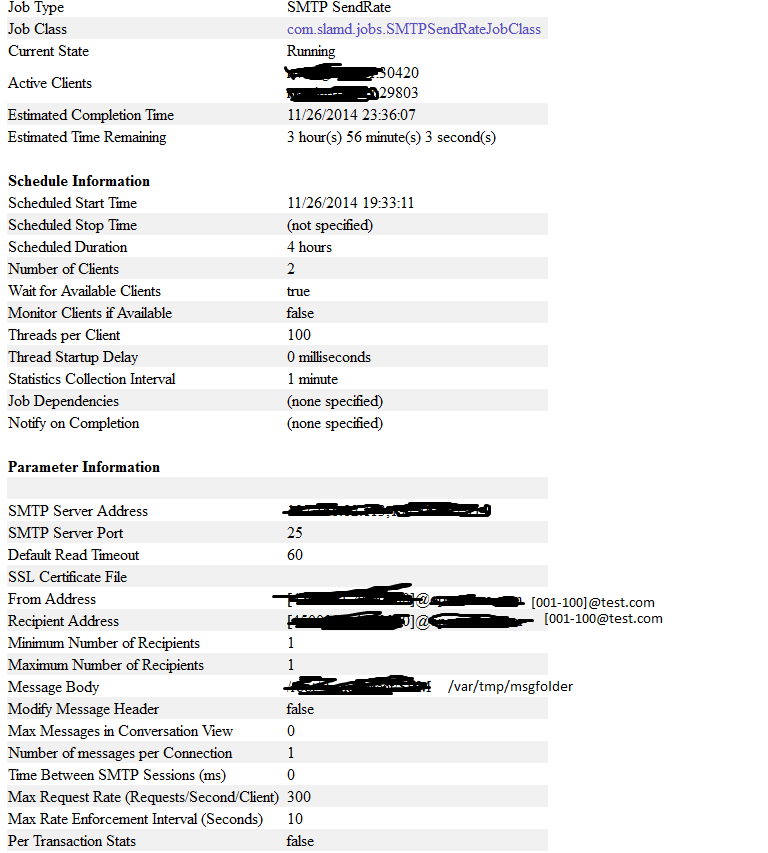
basic of slamd

installation and configuration


 http://dl.thezonemanager.com/slamd/
 SLAMD Server:-
 1. To install the SLAMD server using this package, simply extract the contents of the appropriate archive into the location on the filesystem in which you wish to use SLAMD.
2. define the JAVA_HOME environment variable,
3. Start server bin/startup.sh
4. you should be able access the SLAMD administrative interface in a browser using the URL http://{address}:8080/slamd

SLMD Client:- slamd_client-1.8.0.tar.gz
1. The process of installing the SLAMD client is as simple as extracting the archive containing the client files into the desired location on the client system
2. Configure slamd_client.conf
   - vi /root/slamd_client/slamd_client.conf
   - Add server host/port in SLAMD_ADDRESS/SLAMD_LISTEN_PORT
 3. If you just wish to start a single client, then the start_client.sh shell script can be used to do this on UNIX systems

Note: In both cases, it will be necessary to comment out or remove two lines near the top
of the file that require the file to be edited before it can be used to start the client/server.

How to start test?
1 Goto to slamd admin url - http://<hostt>:8080/slamd
2. Schedule the job.
3. Mail Job Classes > SMTP Send Rate
3. Add details in next page
  - Description,Name, Thread per client,
  - From address, Receipent Address: [10000-20001]@xyz.com
  - Mesage body - <path of msg file>
  - Max Request Rate(TPS) : -